A software review?
This is the first review I’ve even written as a blog post on my nullptr.nl website. Why start now? I considered whether I wanted to associate myself with any particular software and never really felt the need. However, in this case I was asked to review Deleaker by the author Artem Razin (Softanics). For reference, see @deleaker on Twitter or the website. Artem asked me nicely and offered me a license for the product in return and I was actually curious to try a memory leak detection program.
What is deleaker?
According the website deleaker is a ‘Profiler for C++, C#, .NET AND DELPHI’. Let me be clear up front, I have only looked at it from the C++ perspective and particularly only used it as a Visual Studio plugin.
Some features:
- integrates with Visual Studio (I tried VS2019 v16.1.6, the latest release as of July 2019)
- finds different kinds of leaks: memory, GDI, handles and others
- profiles un-managed and .Net code
- supports both 32-bit and 64-bit applications
- has report and export features
Impressions
Installation was really easy, just your regular next, next, finish wizard with no special settings needed. I did experience a little more delay during the installation than I consider ‘normal’, but after waiting an extra minute or two, everything was installed correctly.
First thing I noticed was, that if you try Deleaker without activation of a license, it works fine, it tells you if and what you problem leaks. However, it does not tell you where you leaked it. However, as long as you’re using the 14 Days Trial you will get the full functionality, including source locations where you leaked resources. This means, you can try it before buying, to see what and how much it will find, but to keep using it to solve issues after the trial, you will need to pay for a license.
After entering the license, you get full source-code references and it tells you not only what you leaked, but also where you allocated it.
Debugview++ experiment
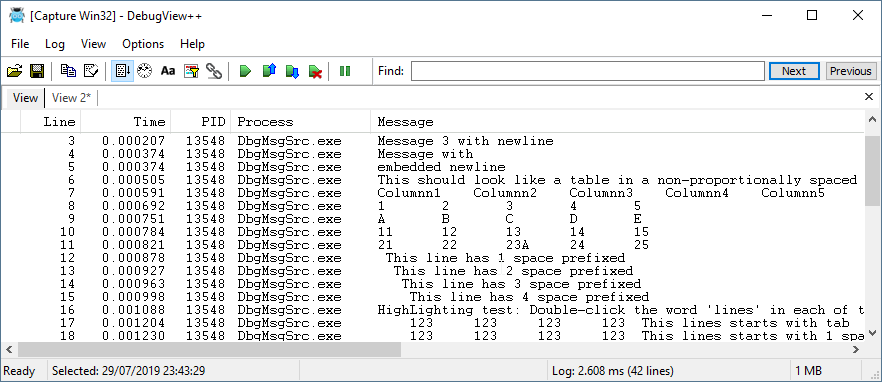
To take Deleaker for a test-spin I took a fresh clone of DebugView++, one of my own open source projects and fired it up. I’m a consistent RAII user and standard library container user, and I felt pretty confident that, without ever actually measuring it explicitly, I did not have any (serious) memory leaks in this application.
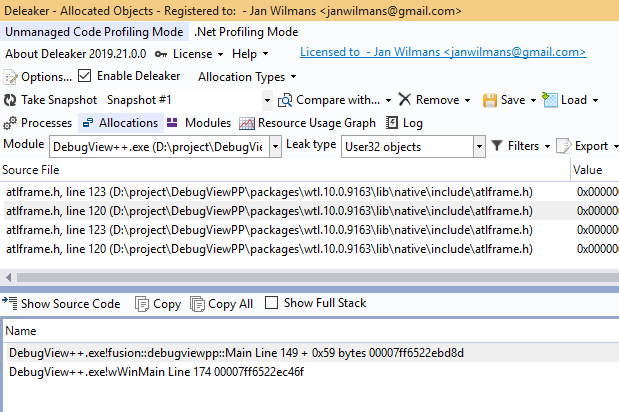
I started the program in debug mode, played around with it and closed it. And… to my surprise Deleaker found I a couple of leaks! Three GDI handle leaks! This was of course completely unacceptable and had to be disproven immediately! After investigation its turned out the GDI handles were indeed leaked and Deleaker reported correctly.
Here is the innocuous looking code:
int CMainFrame::LogFontSizeFromPointSize(int fontSize)
{
    return -MulDiv(fontSize, GetDeviceCaps(GetDC(), LOGPIXELSY), 72);
}
After reading GetDC msdn page it turns out the handle you get from GetDC() must be released using ReleaseDC(). And, I was doing this correctly in almost all cases, except here. In this commit you can see the change I made to solve the leaks. I just used the correct Raii wrapper object to guard the handle’s scope and the leak was solved.
random artificial leak experiment
To see if Deleaker would also detect ‘normal’ memory leaks, I changed one of my std::make_unique<> calls into a (cough) ‘new’ call. Re-ran the program, closed it, and bingo: Deleaker found it immediately.
Conclusion
This is hardly a thorough review of all Deleaker capabilities, but in conclusion I must say I’m impressed. The learning curve to use the tool is extremely low, the interface is clear and the detection seems to work correctly. If you’re searching for a leak detection tool, go try Deleaker, I think you will like it.
Tweet